

Performance Improvements per ASN analysis focuses on the comparison of network performance metrics, specifically packet loss and latency, across different Autonomous System Numbers (ASNs) before and after certain improvements were implemented. The selected time frame for this analysis allows for a comprehensive understanding of the impact these improvements have had on network performance. ASNs are sorted in descending order based on their traffic volume, that helps prioritize ASNs with the highest traffic for a more targeted performance improvement analysis.
The results are presented in a table or graph format, showcasing:
- ASN Identifier: Unique identifier for each ASN
- ASN Name
- Average Packet Loss (Before and After): Showing changes in packet loss.
- Average Latency (Before and After): Indicating changes in latency.
This detailed analysis allows network administrators and stakeholders to evaluate the effectiveness of recent improvements, identify key areas where further enhancements are necessary, and ultimately ensure a more reliable and efficient network performance.
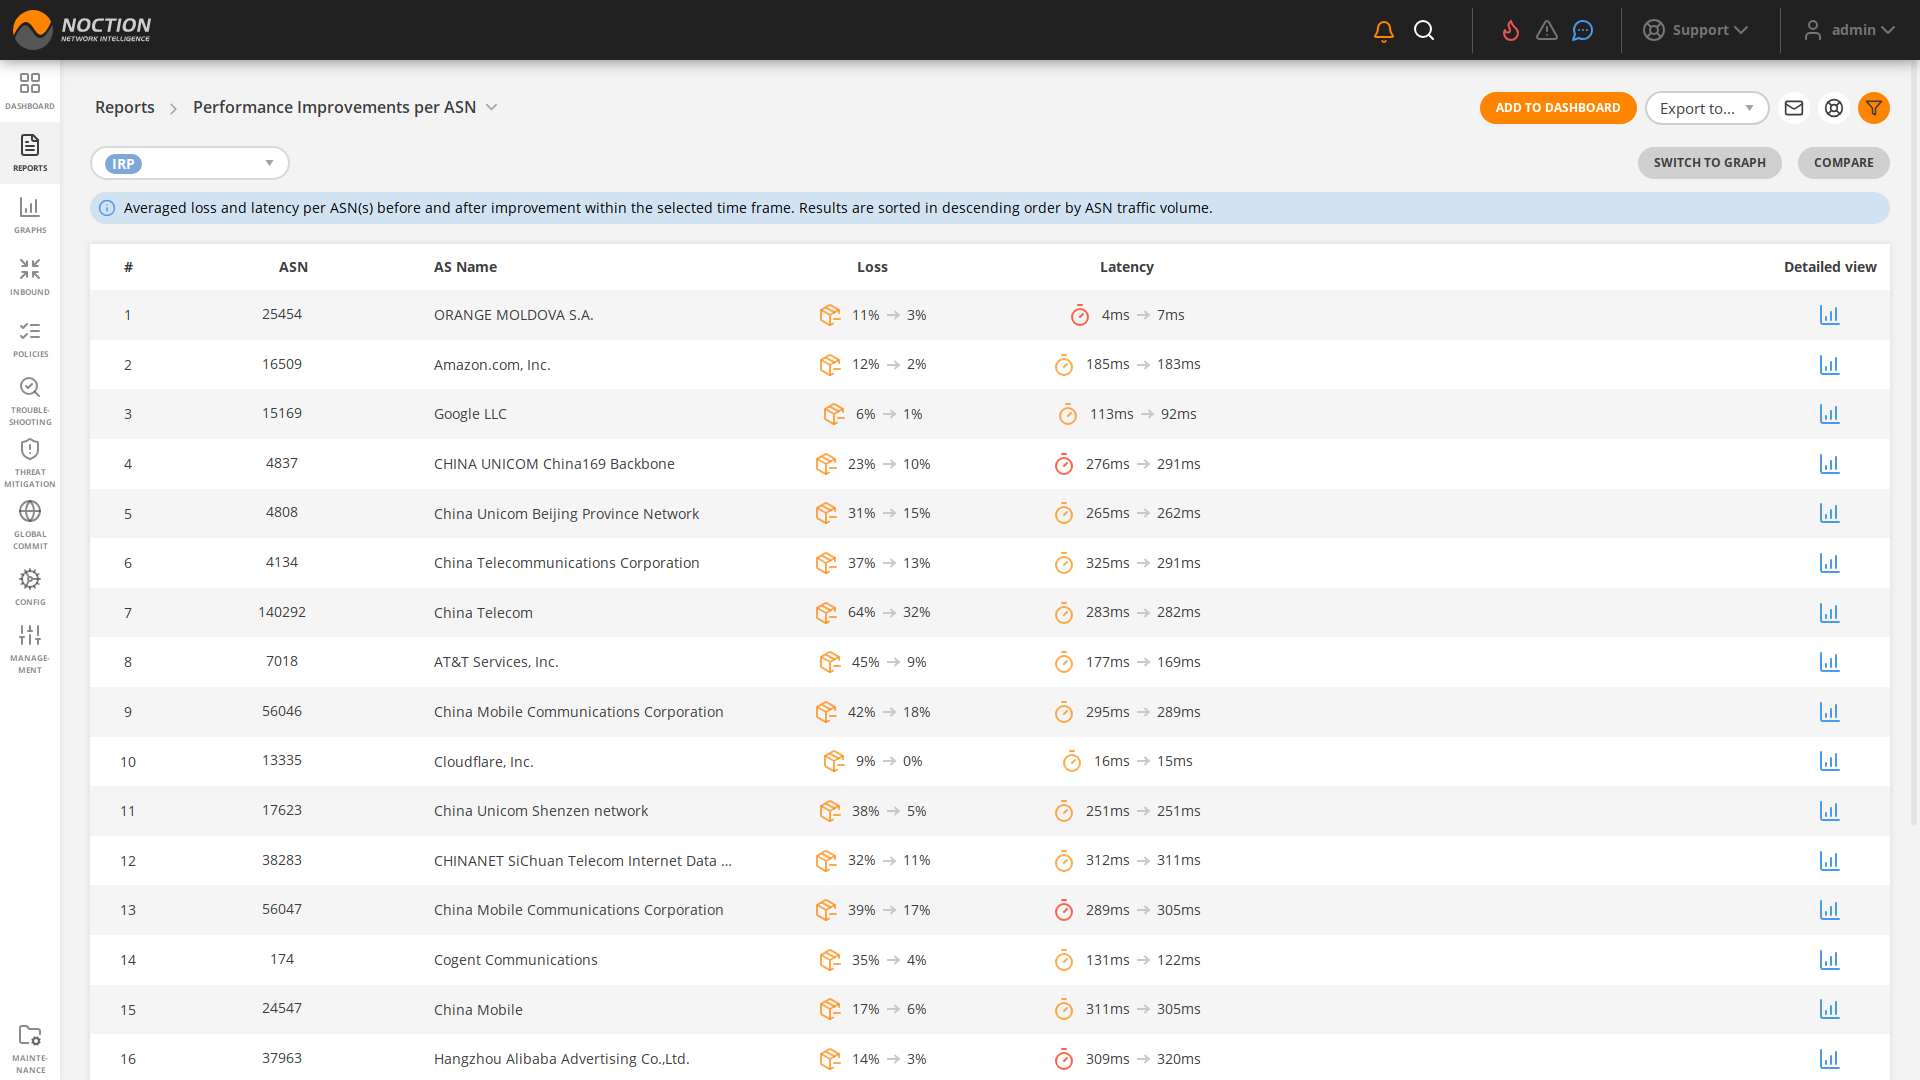
Figure 3.4.21: Performance Improvements per ASN