

The GMI Frontend comes with a comprehensive set of reports, reflecting the current state of the network as well as overall statistics on a particular IRP instance performance. Click on the desired report title to open it.
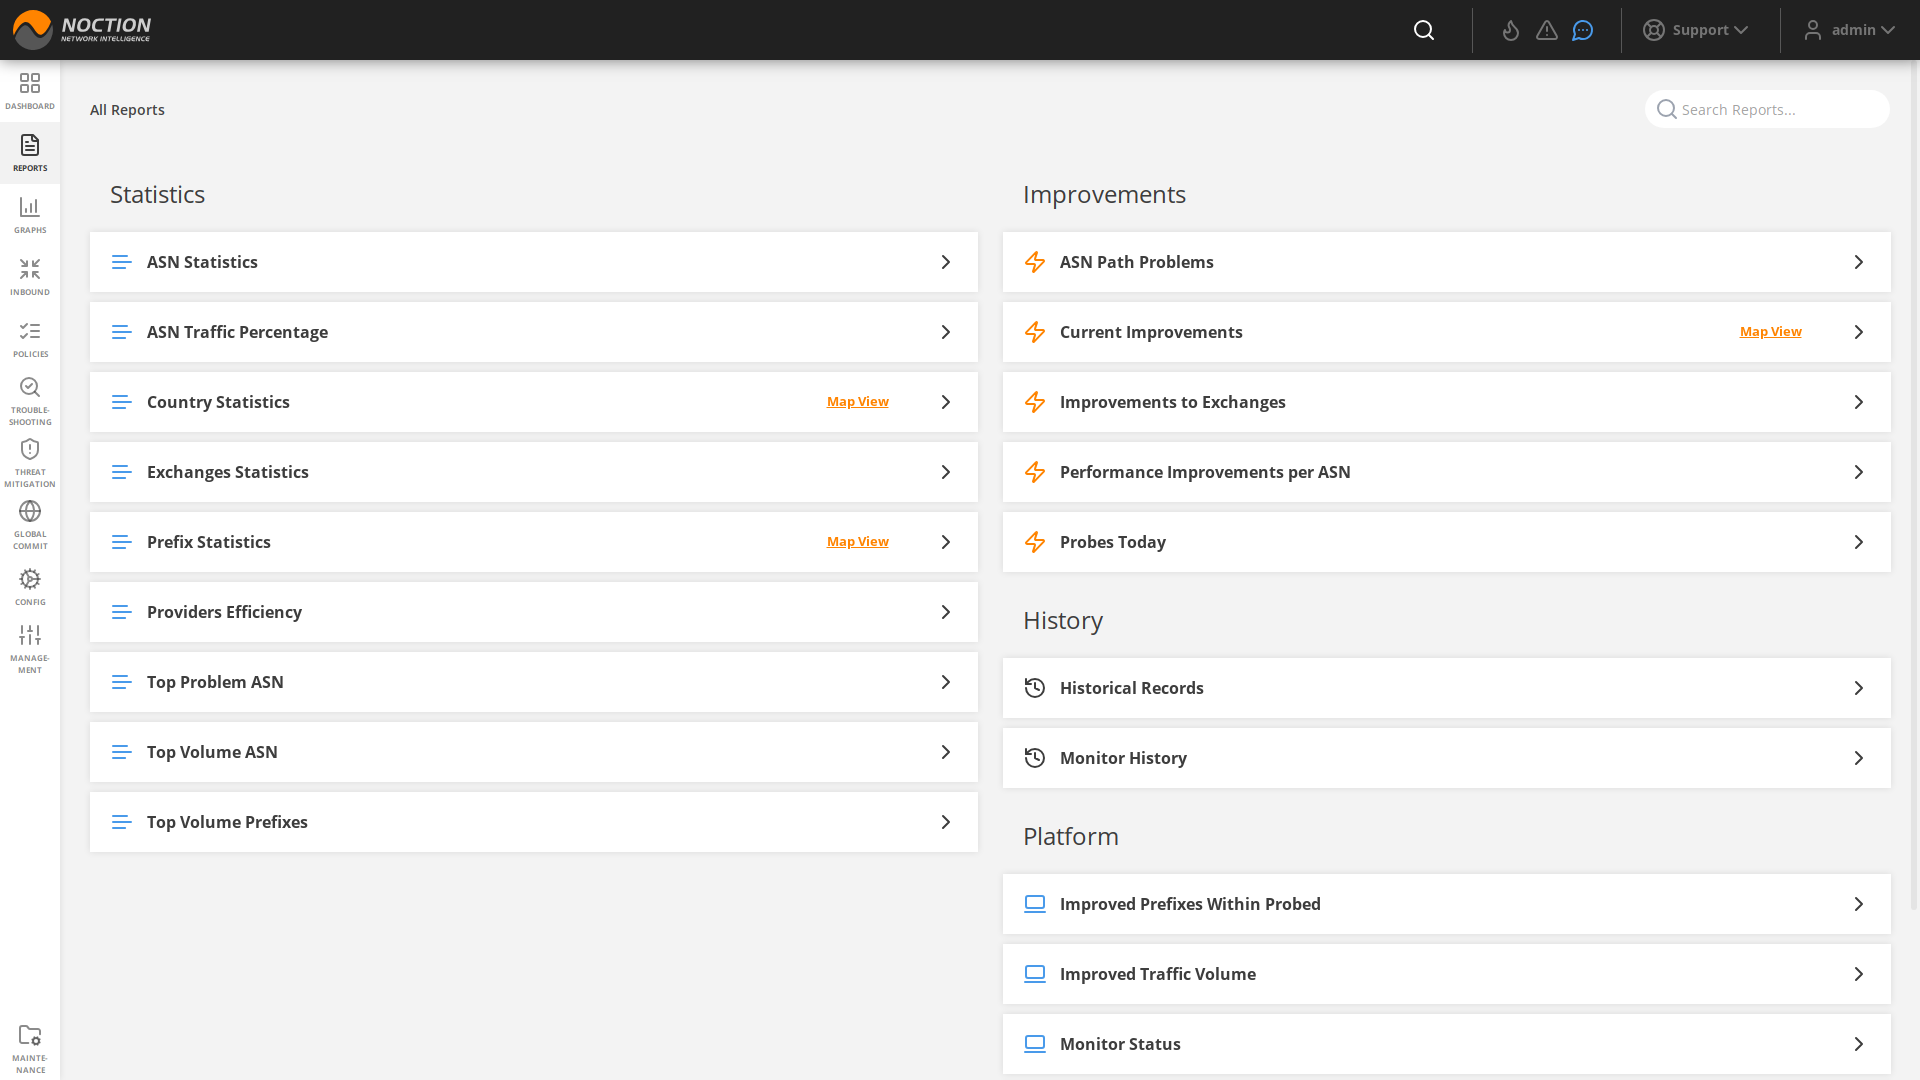
Figure 3.4.1: Reports menu
You can save any report as a widget and add it to any dashboard by clicking the “ADD TO DASHBOARD” button. Select the IRP instance of interest for the report to show relevant data. Filtering options that open up together with a time picker will vary depending on the report type.

Figure 3.4.2: Report options
You can export any report/graph by selecting the desired format (PDF, XLSX, CSV). To print the report, clicking the corresponding print icon.

Figure 3.4.3: Report export and print options
Feel free to subscribe to any report by clicking on the “envelope” icon and filling out fields in the popup form.
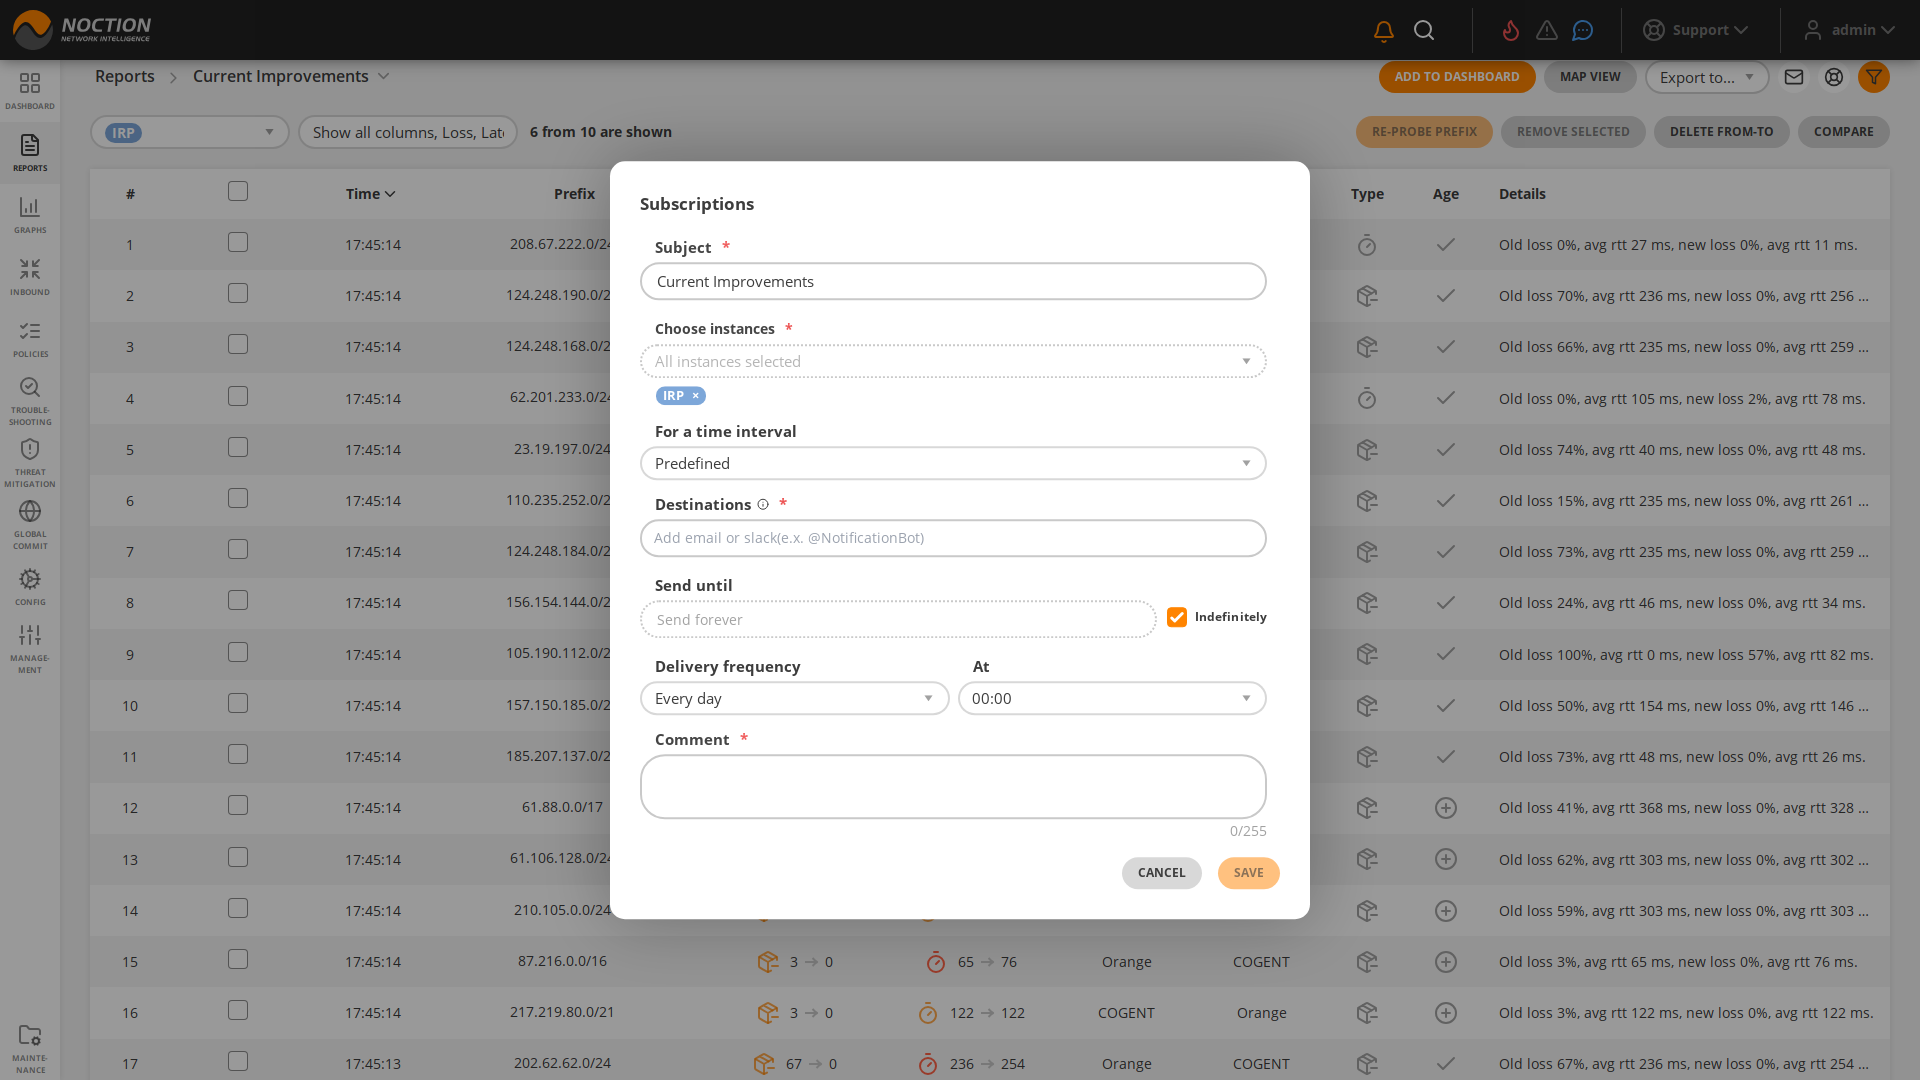
Figure 3.4.4: Report email delivery configuration
When there is a need to compare two separate sets of data within a single report or graph (different filters, time periods, or instances), click the “SAVE FOR LATER COMPARE” button.
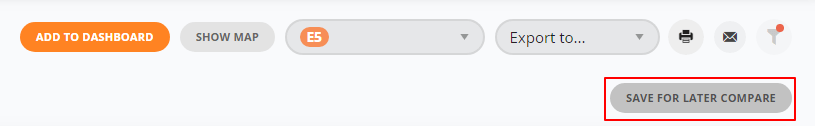
Figure 3.4.5: Save for Later Compare Button
A saved report/graph view will be placed below the current view, allowing you to subsequently introduce new filtering and/or time frame conditions in the top report and compare the two data sets.
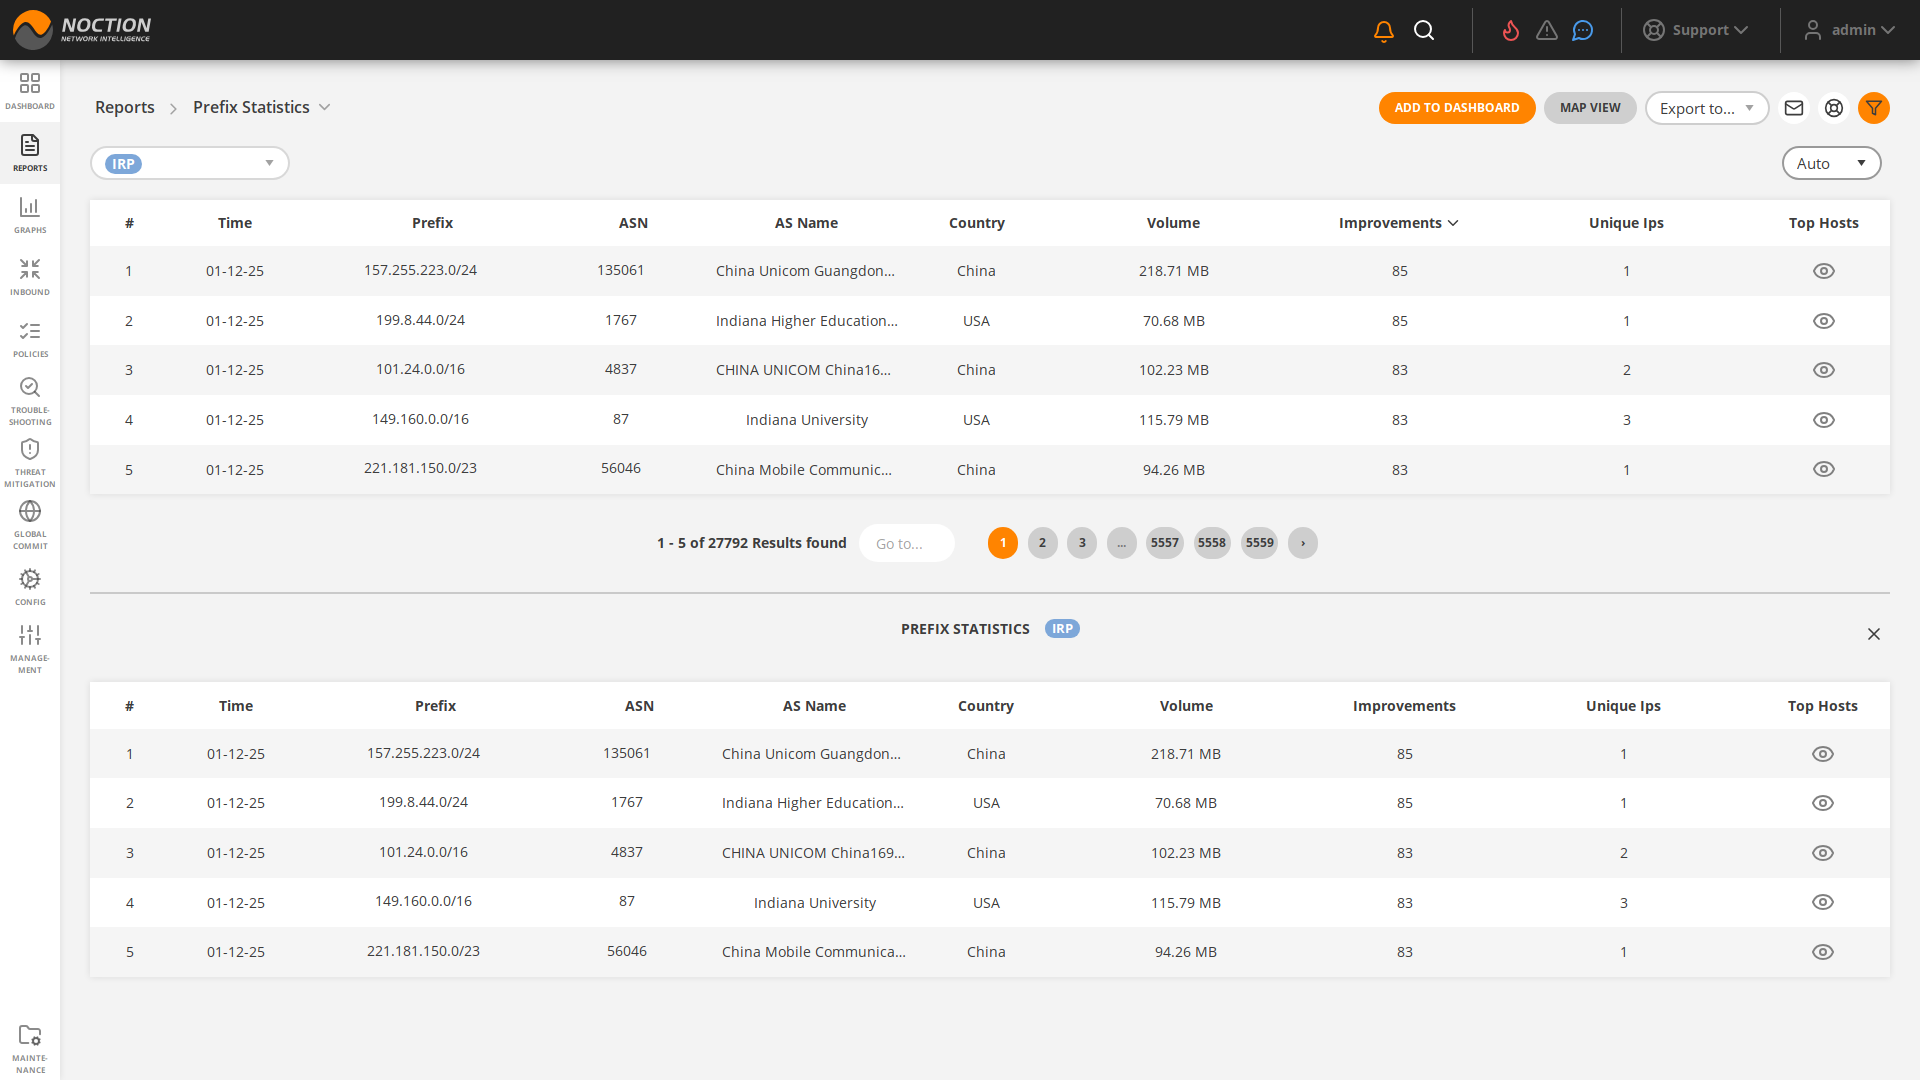
Figure 3.4.6: Save for Later Compare Results