

GMI dashboards are the specific sets of interactive visualizations, designed for quick analysis of the IRP instances performance and informational awareness.
Dashboards consist of widgets which contain a reduced version of any given report or a graph. These can be added, edited, deleted or modified as you like. GMI allows users to set up multiple dashboards.
To see a list of existing dashboards, go to “Default Dashboard > ALL”.
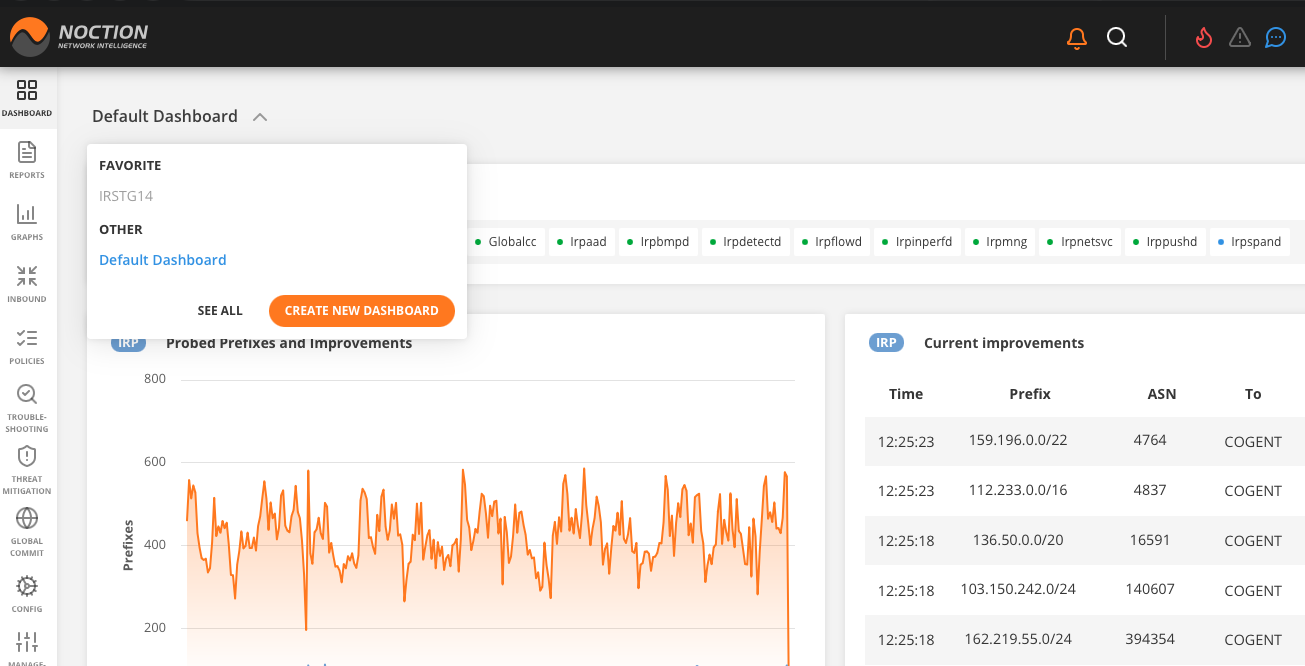
Figure 3.3.1: Dashboard Selection
Dashboards are grouped for easy access into favorite and all. For each dashboard, the directory displays the following information:
- Name The name of the dashboard
Description Dashboard user-defined description
Favorite a state marked by a star icon
List of widgets the names of widgets used in the dashboard
Default status the default dashboard the user lands on when logging into GMI
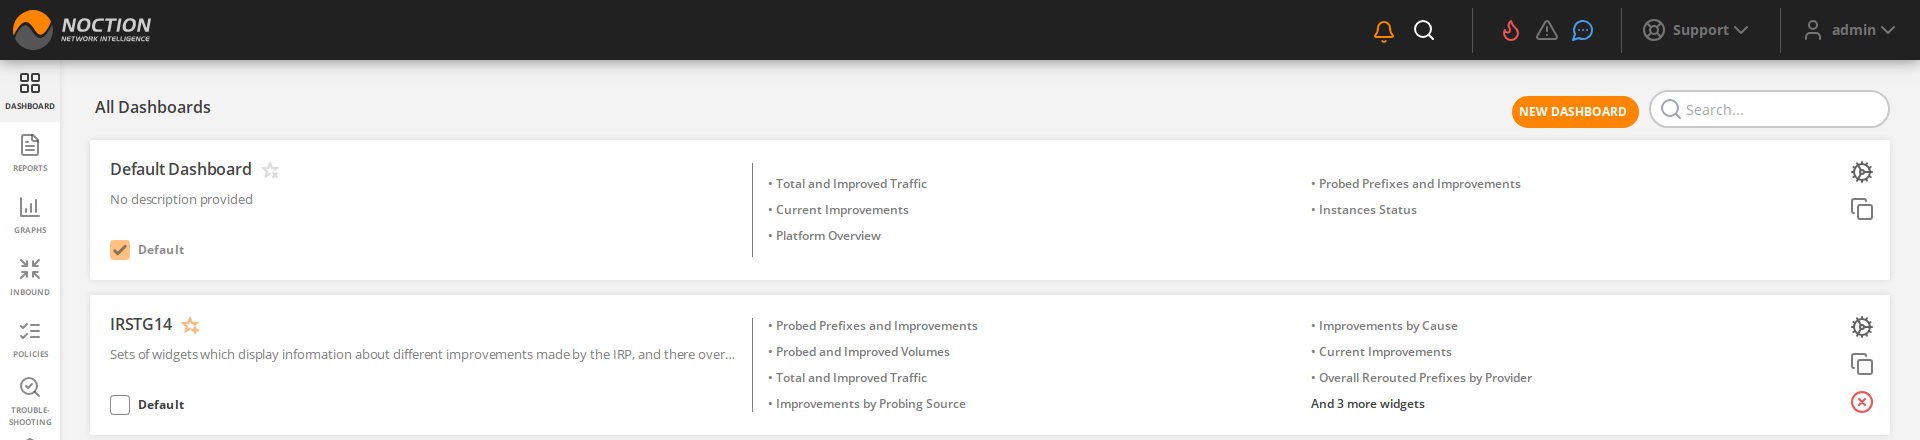
Figure 3.3.2: List of Dashboards