

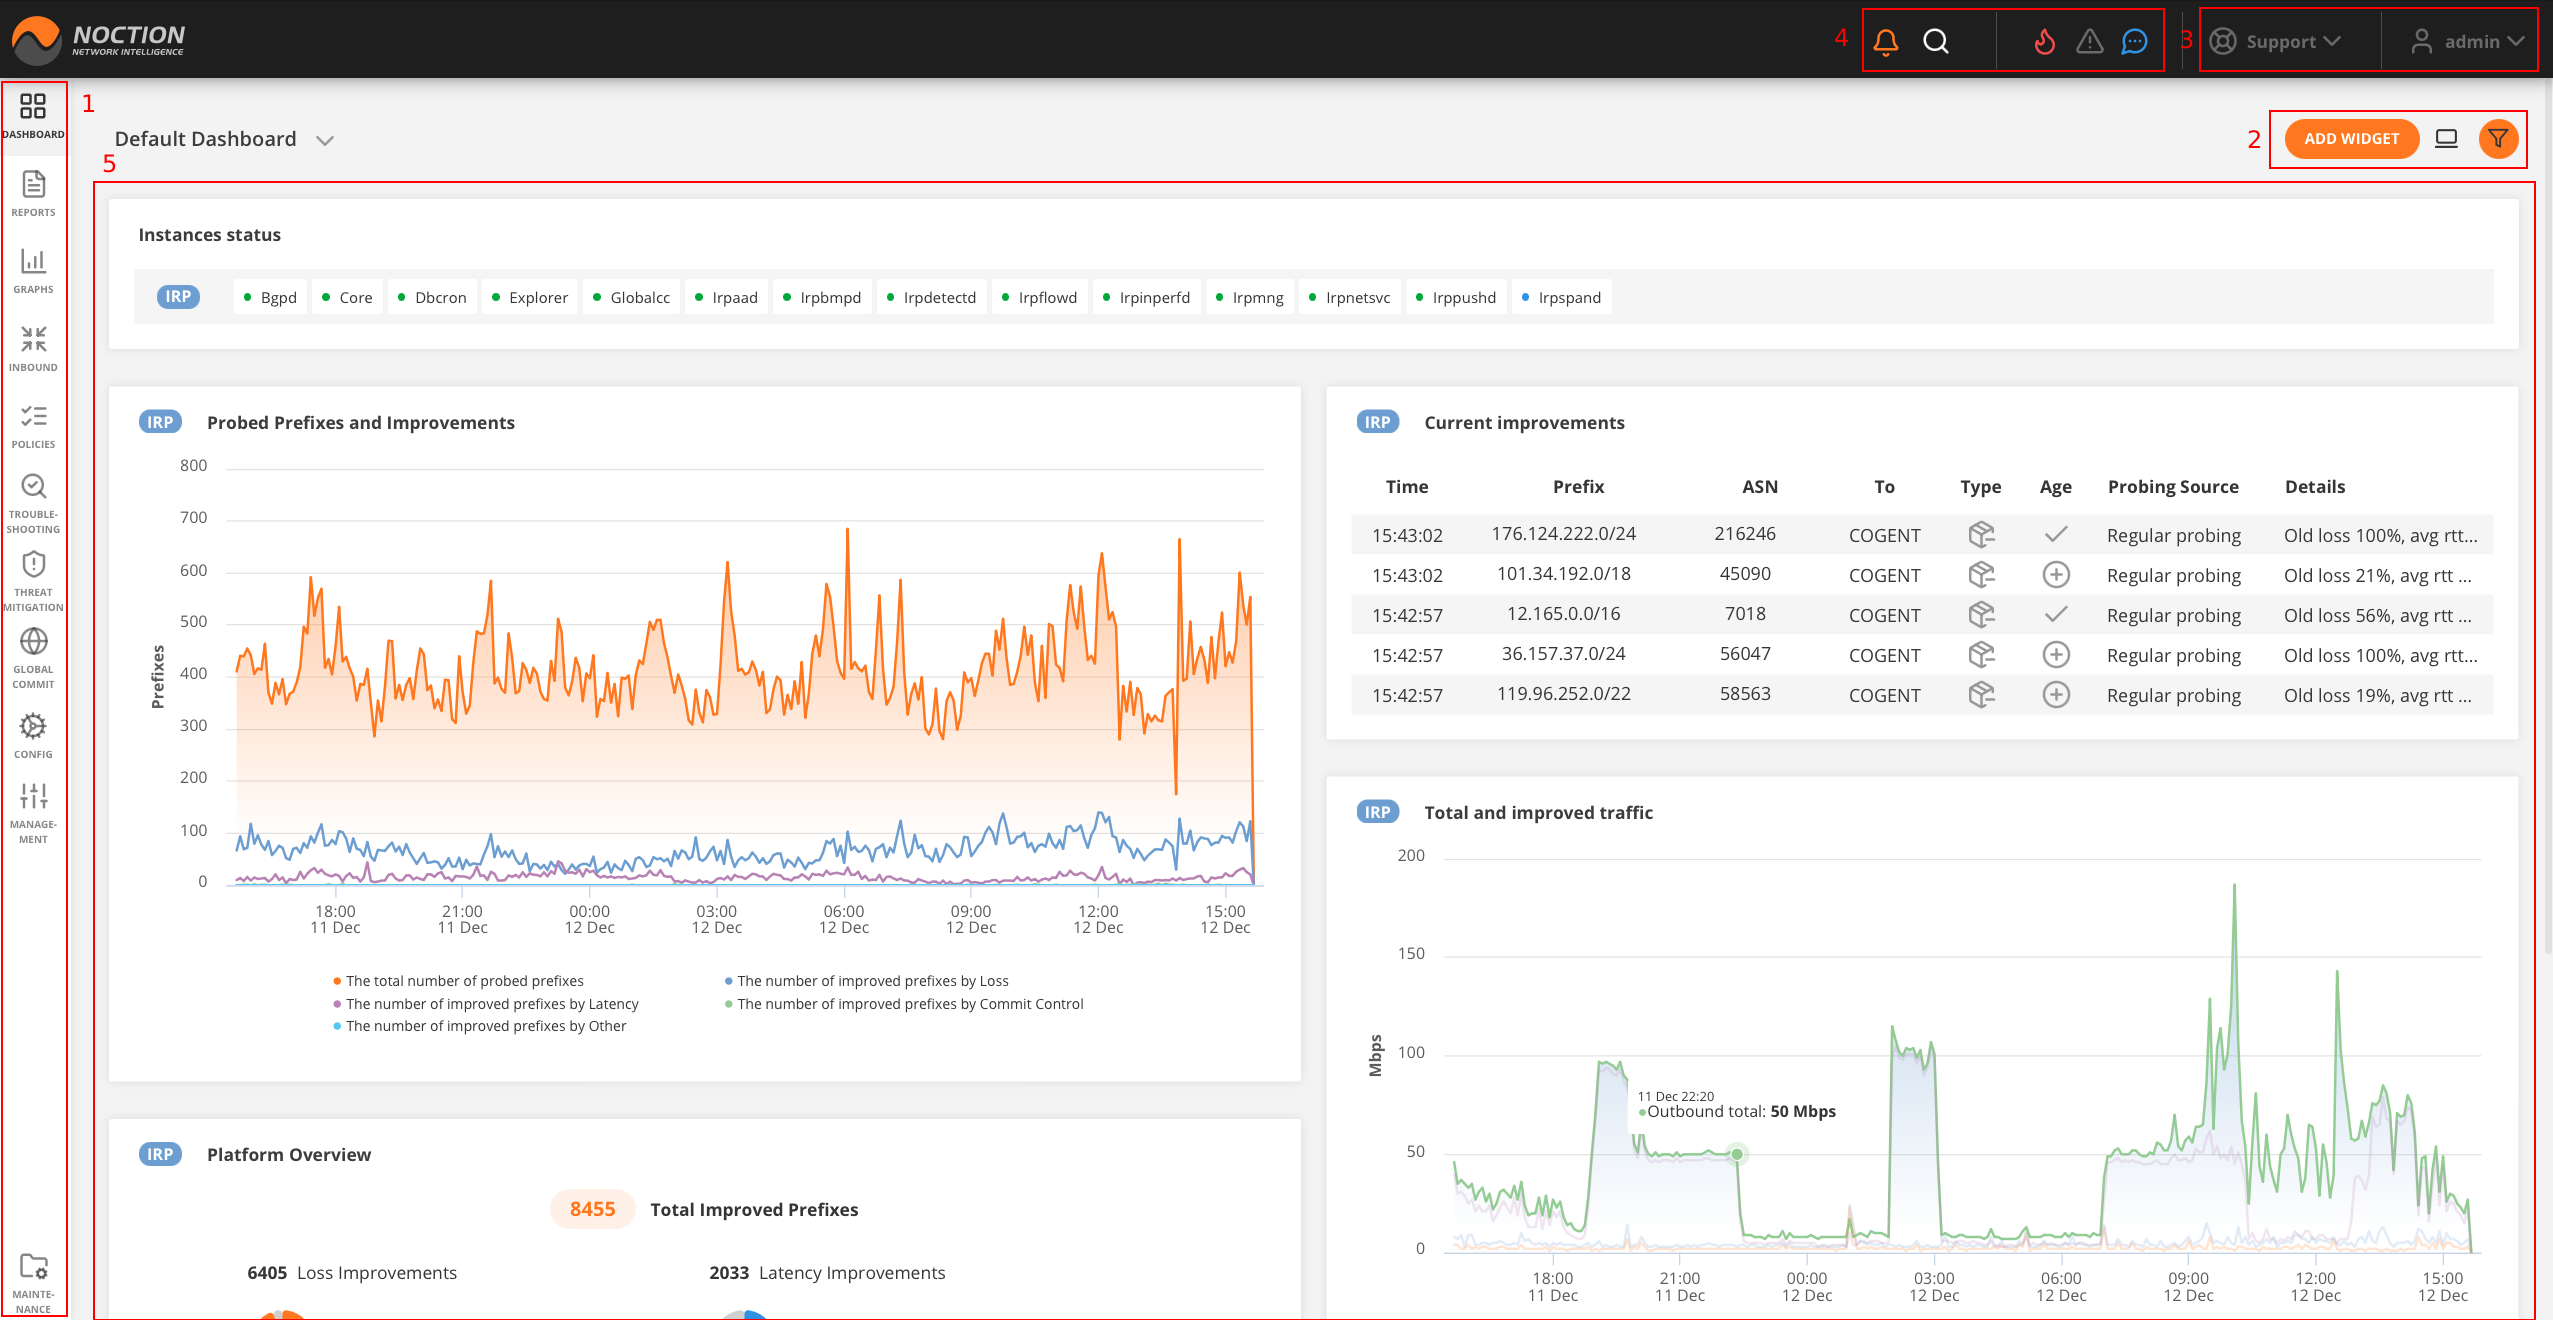
1. The main left sidebar allows quick access to any part of the system via its menu items.
2. A variation of controls appears here in dashboards, reports and graphs depending on the actual view.
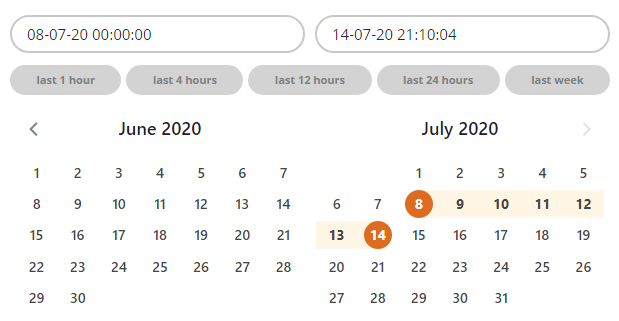
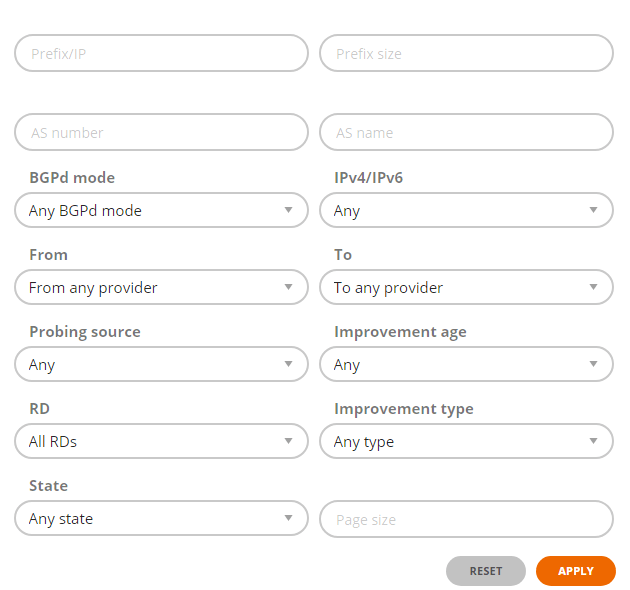
Clicking the timestamp/filter icon opens up the menu on the right side (See section Right Sidebar). Its contents depend on the current page, and include the time selector as well as specific filters, as explained in the next section.
3. Various links to Support, User Guide, Figure: API Documentation and the User account administration are located in the top right corner of the Frontend.
4. The status bar allows one to access system events, notifications and Global Search (See the Events section).
5. Main dashboard area.
Main dashboard area is editable, widgets can be added, removed or rearranged.
3.1.10.1 Keyboard shortcut #
- Dashboard – SHIFT+D
- Reports – SHIFT+R
- Graphs – SHIFT+G
- Inbound – SHIFT+I
- Policies – SHIFT+J
- Troubleshooting – SHIFT+T
- Threat Mitigation – SHIFT+B
- Global Commit – SHIFT+M
- Configuration – SHIFT+C
- Maintenance Window – SHIFT+W
- Management – SHIFT+S
- Search – Ctrl + K
- Instance sidebar – SHIFT+E
3.1.10.2 Right Sidebar #
3.1.10.3 System overview panel #
Clicking a particular IRP short-name button or Shift + E shortcut, opens the right hand side panel with instance-specific information:
- Current amount of traffic as well as a quick bandwidth reference graph for the last 10 minutes
- Number of improvements performed for the last 5 minutes and last 24 hours
- The amount of traffic improved for the last 5 minutes and last 24 hours
- Number of operating iBGP sessions and their statuses
- Announcements to each configured router
- Number of BGP sessions with the providers and their status
- Platform component statuses

See also: GMI Dashboards.