1. Flexible NetFlow Configuration on Cisco Devices
A network topology is depicted in Picture 1. The BGP-1 and BGP-2 network devices are Cisco routers running Cisco IOS 15.6(2)T and are eBGP neighbors. They advertise the subnet 172.16.x.0/24 configured on the interface GigabitEthernet0/0. The Exporter router is the Cisco router running IOS 5.6(2)T configured to collect and export NetFlow records to the Linux host – Collector (192.168.3.2).
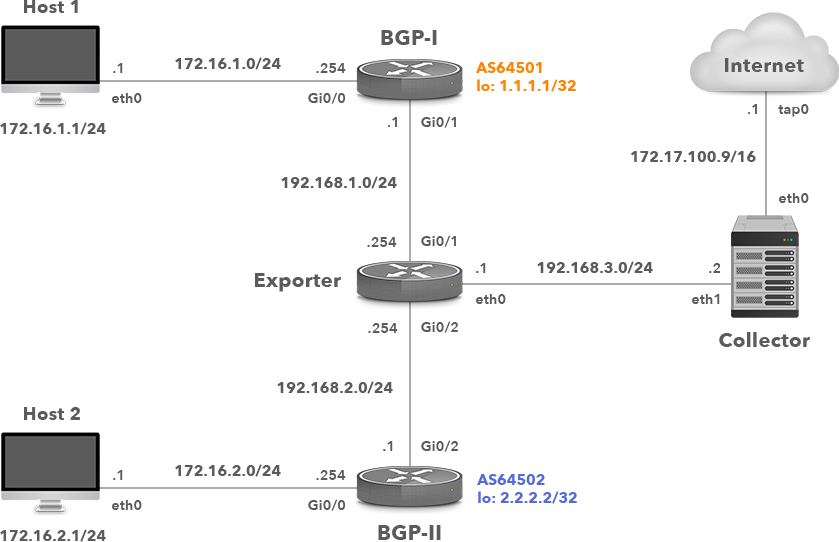
Picture 1: Network Topology with Cisco IOS Flexible Netflow Exporter
Flexible NetFlow allows the user to configure and customize the exported information using NetFlow version 9. Flexible NetFlow is comprised of 3 components:
1) Flow Record
2) Flow Exporter
3) Flow Monitor
The following is a set of commands that are issued on a Cisco router to enable Flexible NetFlow on the GigabitEthernet 0/1 interface and export to the NetFlow collector with IP address 192.168.3.2 on UDP port 2055.
1.1 Flow Record Configuration
IOS-1(config)# flow record NETFLOW-RECORD
IOS-1(config-flow-record)# match ipv4 source address
IOS-1(config-flow-record)# match ipv4 destination address
IOS-1(config-flow-record)# match ipv4 protocol
IOS-1(config-flow-record)# match transport source-port
IOS-1(config-flow-record)# match transport destination-port
IOS-1(config-flow-record)# match ipv4 tos
IOS-1(config-flow-record)# match interface input
IOS-1(config-flow-record)# collect counter bytes
IOS-1(config-flow-record)# collect counter packets
IOS-1(config-flow-record)# collect interface output
1.2 Flow Exporter Configuration
Define IP address and the UDP port of the netflow collector, the interface used for the flow export and the timeout for template export in seconds.
IOS-1(config)# flow exporter NETFLOW-EXPORTER
IOS-1(config-flow-exporter)# destination 192.168.3.2
IOS-1(config-flow-exporter)# source GigabitEthernet0/0
IOS-1(config-flow-exporter)# transport udp 2055
IOS-1(config-flow-exporter)# template data timeout 60
1.3 Flow Monitor Configuration
Specify the active and inactive flow timeout in seconds.
IOS-1(config)# flow monitor NETFLOW-MONITOR
IOS-1(config-flow-monitor)# record NETFLOW-RECORD
IOS-1(config-flow-monitor)# exporter NETFLOW-EXPORTER
IOS-1(config-flow-monitor)# cache timeout active 30
IOS-1(config-flow-monitor)# cache timeout inactive 15
1.4 Associating Monitor to Interface
Apply Flow Monitor on input traffic for all monitored interfaces.
IOS-1(config)# interface GigabitEthernet0/1
IOS-1(config-if)# ip flow monitor NETFLOW-MONITOR input
Verify flow export information (Picture 2) such as a version of the export protocol, the source interface and the IP address, the destination IP address, transport protocol and UDP port.
IOS-1# show flow exporter NETFLOW-EXPORTER
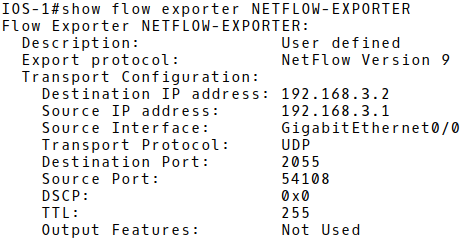
Picture 2: Checking Flow Export Configuration
Show flow exporter statistics (Picture 3) such as sent packets, bytes and NetFlow records to a Netflow collector.
IOS-1# show flow exporter statistics
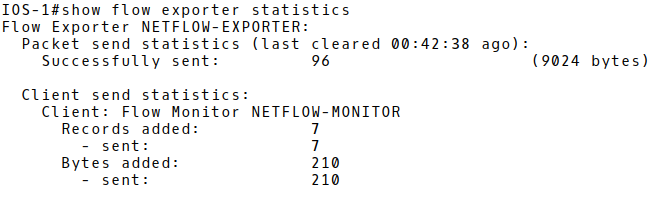
Picture 3: Displaying Flow Exported Statistics
The command below displays the top 10 largest flow records in NetFlow monitor cache (Picture 4). There is only a single flow stored in the Exporter cache. The protocol is TCP (6), with the destination port 179 (BGP). Those are the flow statistic of the BGP message sent from the router BGP-I, a loopback interface with IP 1.1.1.1/32 to the loopback interface of the router BGP-II (2.2.2.2/32).
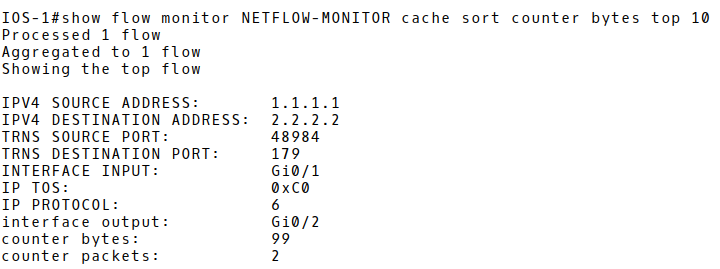
Picture 4: Flow Monitor Cache
1.5 Simulating DDoS Attack with Hping3
We will simulate TCP SYN DDoS attack with a network security testing tool hping3. The attacker (172.16.1.1) is flooding the victim PC-2 (172.16.2.1), the destination TCP port 22 from many spoofed source IP addresses, in order to prevent legitimate users to access SSH server.
Legend:
-c count – number of sent packets
-d – data size 120 bytes
-S – set SYN flag
-w – win size
-p destination port – SSH
–flood – sent packets as fast as possible. Don’t show replies
–rand-source – random source address mode
172.16.2.1 – destination (victim address)
In order to get the information about the outgoing DDoS attack, we will investigate Netflow statistics on the router Exporter (Picture 5). The number of the actual flows is 4088, almost reaching the NetFlow cache size 4096.
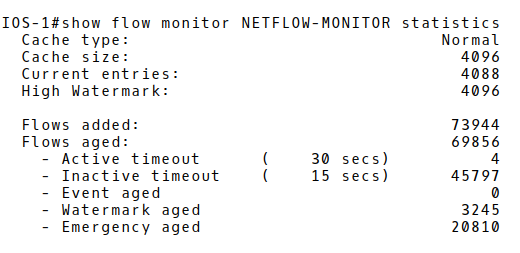
Picture 5: Flow Monitor Statistics
The next step consists of checking the content of the NetFlow cache and saving NetFlow records into the router’s flash memory as a csv file.
Network administrators can use a network traffic analysis tool or the stored_records.pdf report in the process of further investigation of a DDoS attack. The report confirms that PC2 (172.16.2.1), destination TCP port 22 (SSH) is flooded with many single packets from spoofed source IPv4 addresses. The upper layer protocol is TCP (6) which gives the packet size 160Bytes (the payload set by the attacker is 120B + 20B IPv4 header + 20B TCP header.
Picture 6 depicts one of the many captured NetFlow packets that were exported as UDP segments from the flow exporter (192.168.3.1) to the flow collector (192.168.3.2), destination UDP 2055 during the DDoS attacks. The FlowSet2 inside the NetFlow protocol structure contains 45 flows. The structure of flow 1 is depicted in the picture. The host with the spoofed IP address 23.67.156.61 sent a packet with destination TCP port 22 to the host 172.16.2.1.

Picture 6: Captured NetFlow v9 Packet
1.6 Configure Flexible NetFlow Flow Sampling on Cisco IOS
When you apply a sampler to a flow monitor, the overhead load on the router of running the flow monitor is reduced because the number of packets that the flow monitor must analyze is reduced. The reduction in the number of packets that are analyzed by the flow monitor causes a corresponding reduction in the accuracy of the information stored in the flow monitor cache [1].
Firstly, we will remove flow monitor from interface Gi0/1.
IOS-1(config)# interface GigabitEthernet0/1
IOS-1(config-if)# no ip flow monitor NETFLOW-MONITOR input
Create a new sampler and specify the random sampling mode. Select M packets out of an N packet window (1 packet from 100). The flow sampler effectively reduces the load on the device by limiting the number of packets that are selected for analysis.
IOS-1(config)# sampler SAMPLER-1
IOS-1(config-sampler)# mode random 1 out-of 100
| Note: If there is a requirement to decrease the packet rate to 50%, we would set the sampling rate 1 out-of 2. |
Assign the flow monitor NETFLOW-MONITOR and the flow sampler SAMPLER-1 to the interface GigabitEthernet0/1 to enable sampling.
IOS-1(config)# interface gigabitEthernet 0/1
IOS-1(config-if)# ip flow monitor NETFLOW-MONITOR sampler SAMPLER-1 input
Check, the settings we configured for sampling. (Picture 7). There are 5522 packets recorded on the interface GigabitEthernet0/1 reduced to 55 samples.
IOS-1# show sampler SAMPLER-1
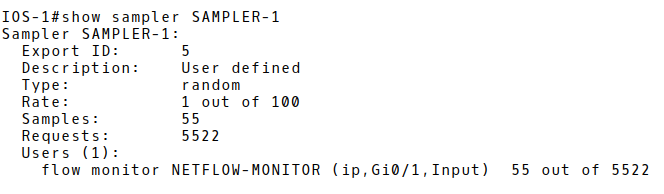
Picture 7: Checking Sampling
2. j-Flow Version 8 Configuration on Juniper vSRX
In order to demonstrate j-Flow v8 configuration on a Juniper device, we will replace the router Exporter (Cisco IOS router with the hostname IOS-1) with an vSRX security device (Picture 8). J-Flow v8 has the same attributes and fields as J-Flow v5, but it allows the aggregation of flows with a specific attribute. J-Flow v8 supports five aggregation schemes, and it conserves memory and bandwidth by exporting targeted flow records rather than all aggregated traffic. J-Flow does not require a license on SRX devices.
The Juniper vSRX appliance in our topology was working as a traditional router, therefore we have switched it into the packet mode. The vSRX appliance can operate in two different modes: packet mode and flow mode. By default, Junos OS on SRX devices works in flow mode. In packet mode, SRX processes traffic as a traditional router on a per-packet basis.
Starting with Junos OS Release 12.1X45-D10 and later, sampling features such as flow monitoring, packet capture, and port mirroring are supported on Ethernet interfaces. On all SRX Series devices in a chassis cluster, flow monitoring for version 5 and version 8 is supported.

Picture 8: Network Topology with Juniper vSRX j-Flow v8 Exporter
2.1 Activate Sampling on Interface ge-0/0/1 and Specify Direction
The command below activates sampling in both direction on the interface ge-0/0/1.
root# set interfaces ge-0/0/1 unit 0 family inet sampling input
root# set interfaces ge-0/0/1 unit 0 family inet sampling output
2.2 Sampling Rate
The rate statement specifies the ratio of packets to be sampled. When you configure a rate of 100, x number of packets out of every 100 is sampled. Activation of flow collection can have a significant impact on the performance of the SRX Series device. The smaller the sample rate, the bigger the impact. A sample rate of 1 provides 1:1 packet sampling, which will log every packet. Therefore, it is recommended to avoid a sampling input rate of 1.
root# set forwarding-options sampling input rate 100
2.3 IP Address and UDP Port Number of the j-Flow Collector
Specify the IP address and UDP port for exporting flows.
root# set forwarding-options sampling family inet output flow-server 192.168.3.2 port 2055
2.4 j-FlowVersion and Aggregation Type
Specify j-flow version (5,8, ASN 500) format, packets will be aggregated in.
root# set forwarding-options sampling family inet output flow-server 192.168.3.2 version 8
The aggregation type for j-Flow v8 will be based on source and destination prefix and compatible with Caida record format for the prefix aggregation.
root# set forwarding-options sampling family inet output flow-server 192.168.3.2 aggregation source-destination-prefix caida-compliant
2.5 NTP server
NTP server is a must when j-Flow is configured.
root# set system ntp server 147.251.48.140
We have finished the j-Flow v8 configuration on vSRX appliance so we can apply the configuration changes with the command commit.
Root# commit
2.6 j-Flow Configuration Testing
In order to check if flow records are exported to the NetFlow collector (192.168.3.2), we will again start the DDoS attack with the hping utility on PC1. Packet monitoring is enabled on the interface ge-0/0/0.0 of vSRX appliance and limited to capturing packets with the port 2055 in order to avoid slowing down our vSRX appliance.
root> monitor traffic interface ge-0/0/0.0 no-resolve size 1500 matching matching "port 2055" extensive
The captured j-Flow packets depicted in Picture 9 confirm that flows are successfully exported to the collector IP address 192.168.3.2, the destination UDP port 2055.
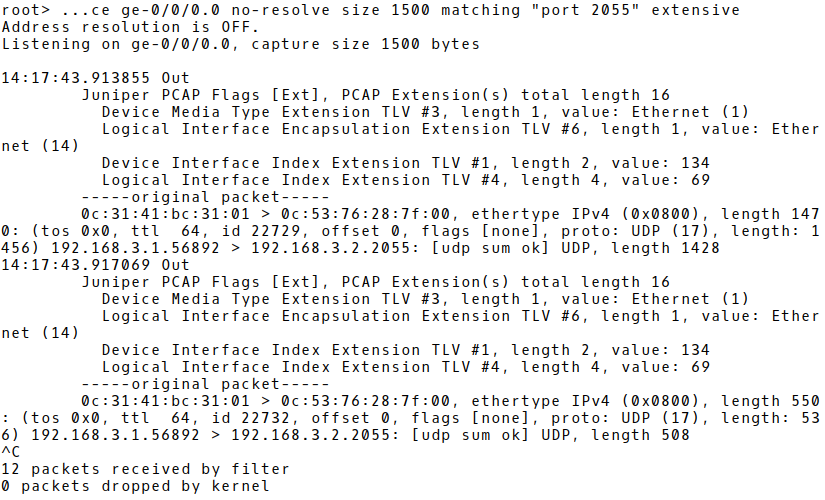
Picture 9: Monitoring j-Flow Packets on vSRX
The structure of a j-Flow packet captured by Wireshark on the interface ge-0/0/0 is depicted in Picture 10. The packet consists of 22 PDUs. The PDU number 1 contains a single flow with the spoofed source address of the attacker PC 1 (167.51.168.0) and the destination address of the victim‘s PC – 172.16.2.1.
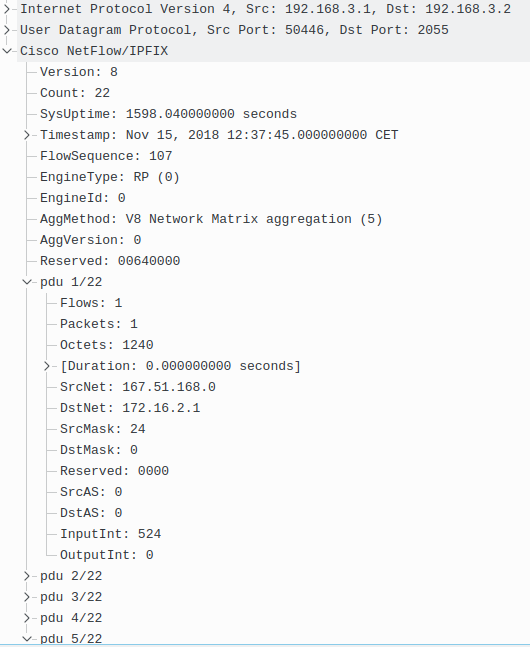
Picture 10: Structure of j-Flow Packet Captured by Wireshark
Conclusion:
The configuration of NetFlow differs across vendors as they implement their own NetFlow flavors if the standardized version such as IPFIX (RFC 7011) is not preferred. In this tutorial, we have configured a Cisco Flexible NetFlow and Juniper j-Flow and checked whether the flow records are exported to a flow collector under a DDoS attack. Our next blog post will explain the process of NetFlow configuration on a Linux-based network VyOS and Huawei (NetStream).