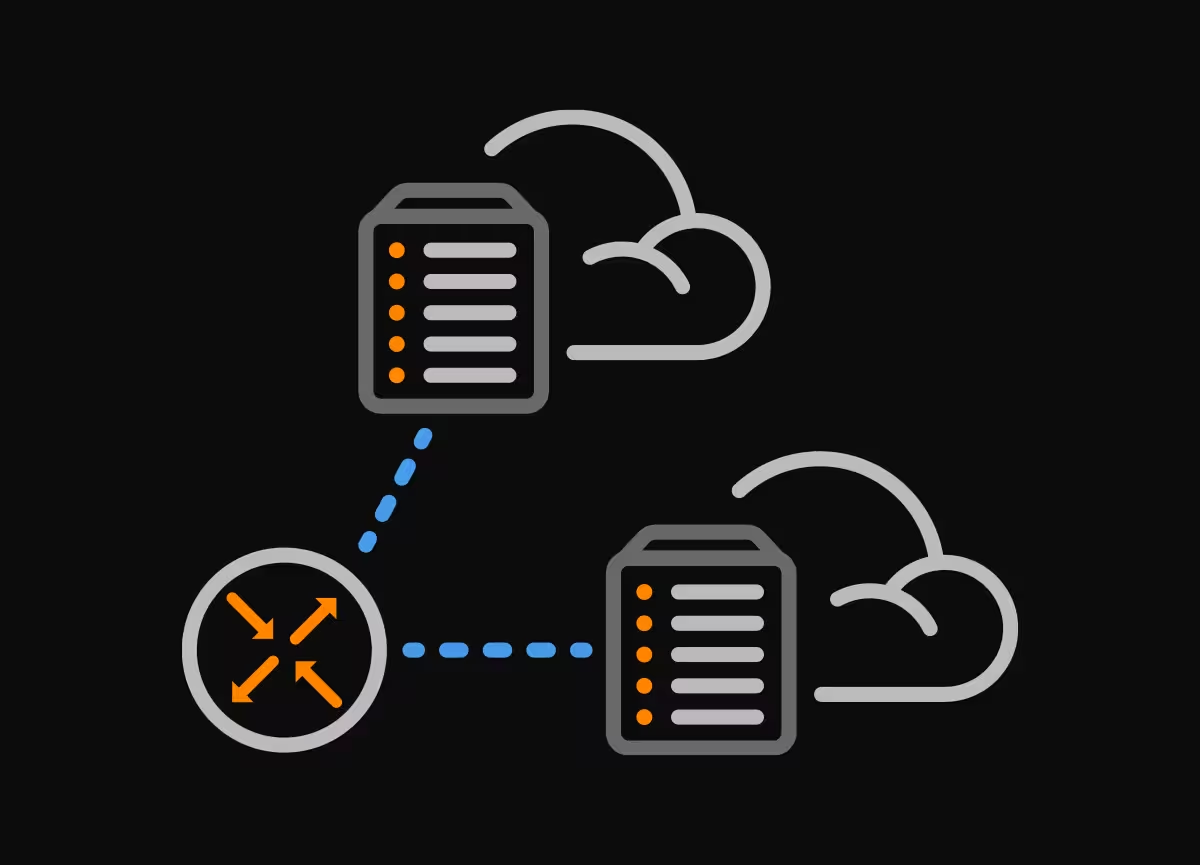
 This article gives some insights on how to set up a network traffic analysis and alerting system based on NetFlow. NetFlow is an advanced and widely used technology that provides detailed information to help you analyze traffic for any abnormalities. It allows determining the true cause of issues such as network congestion, latency or sudden traffic spikes. The flow-based technology, therefore, should be a logical and essential part of any network traffic monitoring and alerting system.
NetFlow was first introduced in Cisco devices. The technology enables network administrators to identify traffic source and type, as well as many other attributes. It provides detailed information such as Layer2 (VLAN ID, MAC addresses) Layer3 (IP addresses, ToS, ICMP, VRFs), Layer4 (TCP/UDP) and Layer7 (BGP origin and peer ASs, BGP next-hop IP).
Before you get your hands dirty setting up an alerting system based on NetFlow, read some of the tips you should follow for network monitoring success.
Identify Critical Assets
Critical assets are typically those with major consequences if they fail. These are not necessarily the devices with a high likelihood of failure. A critical asset can be a server hosting mission-critical application for your business, a core router or a firewall sitting on a network perimeter that keeps your network safe from outside intruders. Most of the successful breaches are caused by attacks that are being conducted for long time periods, such as days, weeks or even months. For this reason, it is important to ensure that flows from critical devices are collected continuously representing a reliable and accurate source of information about network traffic.
Create Network Monitoring Polices
Network monitoring policies define a purpose and a scope of monitoring and technologies used for this purpose while maintaining the confidentiality of all information gathered as a result of network monitoring. They provide answers to questions such as where to place a flow exporter into your network. Typically, a single flow exporter is placed on a central device, however, you can configure more exporters if needed. In this case, you also need to employ deduplication on a flow collector to avoid duplicate entries. Ideally, you should collect and export flows from a single centralized device where all traffic flows through. Policies also answer the question of which information is to be collected. Do we need to aggregate flows based on a certain criterion in order to decrease the volume of flow records? Or do we need to collect additional information such as Layer2 or Layer7? Confidentiality of collected data is also addressed by a monitoring policy. Is it a network admin who is allowed to access the obtained data or is it a job of a security department only? Where is data stored? What is an expected action when an alert is triggered, who is involved? And finally, who is in charge of updating network monitoring policies? These all are the questions that a good monitoring policy must reliably answer.
Create Baselines for Network Performance
Network performance baseline is a set of metrics used in network performance monitoring to define the normal working conditions of an enterprise network infrastructure [1]. The purpose of setting a performance baseline is to define what is normal for your network and identify changes in traffic that could indicate issues. A good baseline provides information on whether a sudden spike of traffic is within a defined range or not. For instance, traffic spikes should be expected within a busy period while the same values outside the period may indicate an issue. Therefore, setting a baseline is a process that should be conducted over a certain time period, within a defined scope. Also, the traffic volumes vary in different corners of your network. Very likely you can see large traffic volumes at the core layer level, while the same volume on an access switch may indicate an issue e.g with connected hosts. Your baseline should reflect it.
Setting a baseline for network monitoring is not limited to the scope of network bandwidth utilization. The baseline should be also set for network protocols to catch traffic patterns and NetFlow helps a lot in this process. As a result, you can reliably identify whether a sudden increase in network traffic indicates a brute-force against your server or whether it is an expected scenario.
Define Alerts and Thresholds
Network traffic analysis and alerting systems use thresholds that define acceptable network performance. When the value exceeds a threshold, e.g an appropriate number of packets (PPF) or bytes per flow (BPF), an alert of a threshold breach is sent. For instance, a force attack against SSH hosts consists of scan, brute-force and compromise phase that can be detected based on their typical traffic characteristics. During the SSH brute-force phase, PPF, BPF, and duration values are alike. The series of login attempts are repeated in a loop, causing identical application-layer actions until the right login credentials are found. Traffic is flat in terms of PPF, BPF, and duration within the phase, changing only with the next phase. Therefore, a transition between phases can be reliably identified and the attack detected based on NetFlow data analysis.
Thresholds must be updated whenever your network infrastructure is changed, for example, if new devices or services are added into your network, otherwise, the false positive ratio (FPR) may increase. In any case, the configuration of optimal threshold values is a major challenge for network administrators. Some of the most important alerts that need to be addressed are “no traffic”, “high utilization” and “slow response time”.
If there is no traffic in a network, no flow records are generated and exported from a NetFlow exporter to a collector. Typical reasons for missing traffic are link and device failures, disconnected cable, misconfiguration or problem in the provider’s network.
High utilization may signalize that link capacity is close to a limit. However, it might not be an issue, unless high utilization is connected with the slow response time. NetFlow is very good at reporting overall bandwidth utilization and, unlike SNMP, it can also measure bandwidth usage for each connection. Setting a threshold for high utilization should reflect sudden traffic spikes during busy hour periods, otherwise, network admins will be flooded with excessive fake positives.
Slow response time may be frustrating for users however, they do not report it as often as other issues. Being able to detect network latency and generate alerts based on a configured threshold is important. This helps network administrators further take action and understand if an issue is related to a network or if there are other reasons involved such as slow applications etc.
Conclusion:
Network traffic analysis and alerting system is a critical element of your network infrastructure. NetFlow technology serves as a base stone for this element. It gives you end-to-end traffic visibility, providing detailed statistics on bandwidth usage, real-time and historical traffic patterns, as well as application usage.