 Effective network monitoring plays a crucial role in modern network management. To achieve this, protocols like NetFlow v9 and IPFIX utilize various key elements, including Observation Point, Metering Process, Observation Domain ID, and Source ID. These elements enable administrators to gain comprehensive visibility into network traffic and extract valuable insights.
This article will delve into the significance of each of these elements and how they contribute to effective traffic analysis. We will explore their roles in orchestrating network flow monitoring and management. Additionally, we will examine two different configurations to illustrate these concepts and provide practical examples.
By understanding these concepts, network administrators and analysts can enhance their ability to monitor and analyze network traffic, enabling them to make informed decisions and optimize network performance.
1.1 Observation Point
An observation point refers to a specific location within a network infrastructure where packets are observed. It can be a physical or logical entity, such as a router interface, a switch port, a virtual machine or any other device capable of exporting flow information.
Observation points are crucial for gaining comprehensive visibility into network traffic. By strategically placing observation points throughout the network, administrators can monitor traffic at various critical points and obtain valuable insights into the behavior of applications, users, and devices.
1.2 Metering Process
The metering process is responsible for observing packets passing through an observation point, timestamping them, and classifying them into flows based on defined criteria. It manages all the Flows generated from an Observation Domain. The functions of a Metering Process include:
Maintaining databases of flow records: This involves creating new flow records, updating existing ones, computing flow record statistics, and deriving further flow properties based on packet treatment (in some cases, fields like AS numbers, router state, etc.).
Maintaining statistics about the metering process itself: This includes tracking metrics such as the number of flow records generated, packets observed, and other relevant statistics for monitoring and performance analysis.
1.3 Observation Domain and Observation Domain ID
The Observation Domain is a logical block that presents a single identity for a group of Observation Points within an IPFIX Device. Every Observation Point is associated with an Observation Domain.
An IPFIX Device could have multiple Observation Domains, each of which has a subset of the total set of Observation Points in it. Each Observation Domain must have an assigned unique ID within the context of an IPFIX Device.
In the case of multiple Observation Domains, a unique ID per Observation Domain must be transmitted as a parameter to the Exporting Function. As previously mentioned, this unique ID is referred to as the IPFIX Observation Domain ID and is unique per the IPFIX Exporting Process [RFC 7011].
1.4 Source ID
In NetFlow v9, the Source ID field serves to identify the exporter’s observation domain. It helps NetFlow collectors distinguish between different export streams originating from the same exporter and allows for the separation of flows from different exporters. To delve deeper into the significance of the bits within the Source ID field, we encourage you to explore our article.
2. Configuration 1: Single Exporting Process
Let’s illustrate the concept of Observation Point and Observation Domain within the network infrastructure depicted in Figure 1. The Exporter is a Cisco router that hosts a single Exporting Process. The role of the Exporting Process is to send IPFIX Messages to the Collecting Process (Collector).
The Observation Domain is composed of interfaces GigabitEthernet 2 and 3, each of which is an Observation Point in the same Observation Domain Id 256.
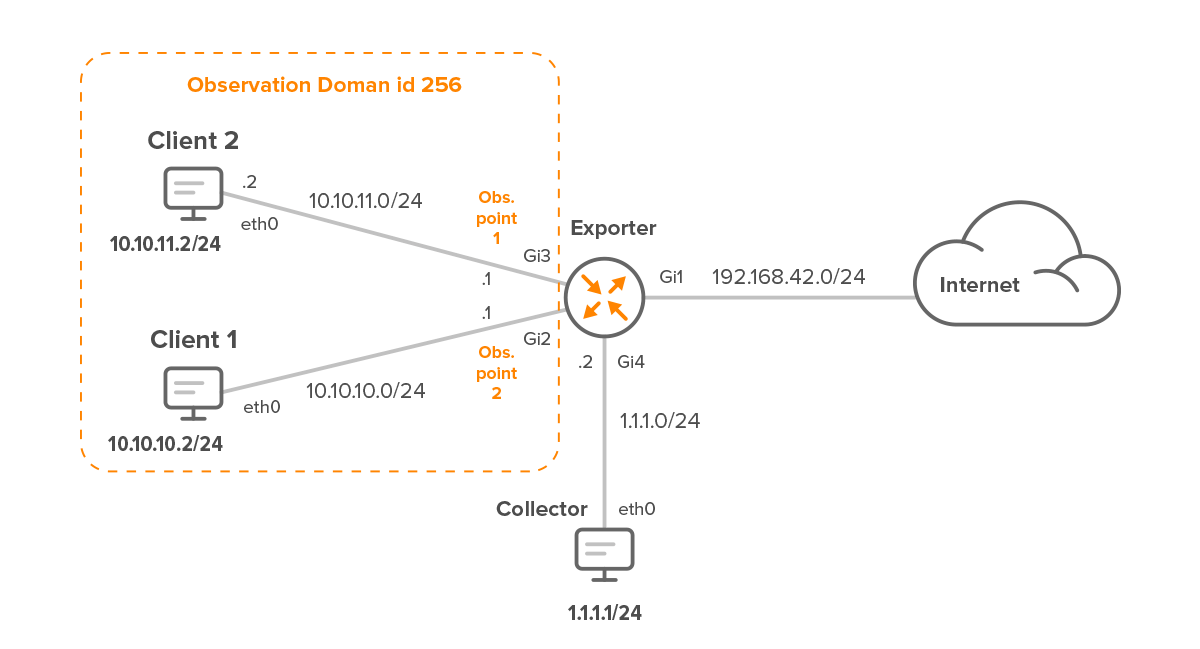
Figure 1 – Network Topology with Single Exporting Process
2.1 Flow Record
The Flow Record RECORD-1 matches various fields such as IPv4 protocol, source and destination addresses, transport source and destination ports, and application name. It collects information including input and output interface, flow direction, number of bytes, and number of packets.
flow record RECORD-1
  match ipv4 protocol
  match ipv4 source address
  match ipv4 destination address
  match transport source-port
  match transport destination-port
  match application name
  collect interface input
  collect interface output
  collect flow direction
  collect counter bytes
  collect counter packets long
2.2 Flow Exporter
The Flow Exporter EXPORTER-1 specifies the destination IP address (1.1.1.1) of the collector, source interface (GigabitEthernet4), and transport protocol (UDP 2055). It uses IPFIX export protocol and includes options for exporting interface and application tables.
flow exporter EXPORTER-1
  destination 1.1.1.1
  source GigabitEthernet4
  transport udp 2055
  export-protocol ipfix
  option interface-table
  option application-table
2.3 Flow Monitor
Flow monitor FLOW-MONITOR-1 configuration associates with the exporter (EXPORTER-1) and the flow record RECORD-1.
flow monitor FLOW-MONITOR-1
  exporter EXPORTER-1
  record RECORD-1
2.4 Interfaces
Both GigabitEthernet2 and GigabitEthernet3 interfaces are configured to apply the flow monitor FLOW-MONITOR-1 to incoming traffic (input direction). Each interface is assigned an IP address within different subnets (10.10.10.1/24 and 10.10.11.1/24, respectively).
interface GigabitEthernet2
  ip flow monitor FLOW-MONITOR-1 input
  Ip address 10.10.10.1 255.255.255.0

interface GigabitEthernet3
  ip flow monitor FLOW-MONITOR-1 input
  ip address 10.10.11.1 255.255.255.0
The IPFIX message encapsulated in the transport layer of IP packet is shown on Figure 2. The IPFIX Message originates at the Exporting Process on Exporter and carries the IPFIX records to the Collecting Process on the Collector with IP 1.1.1.1.
Flow 1 includes metadata about an ICMP request sent from 10.10.10.2 to the Google IP address 8.8.8.8, with a total of 169 packets observed on the observation point – interface GigabitEthernet2.
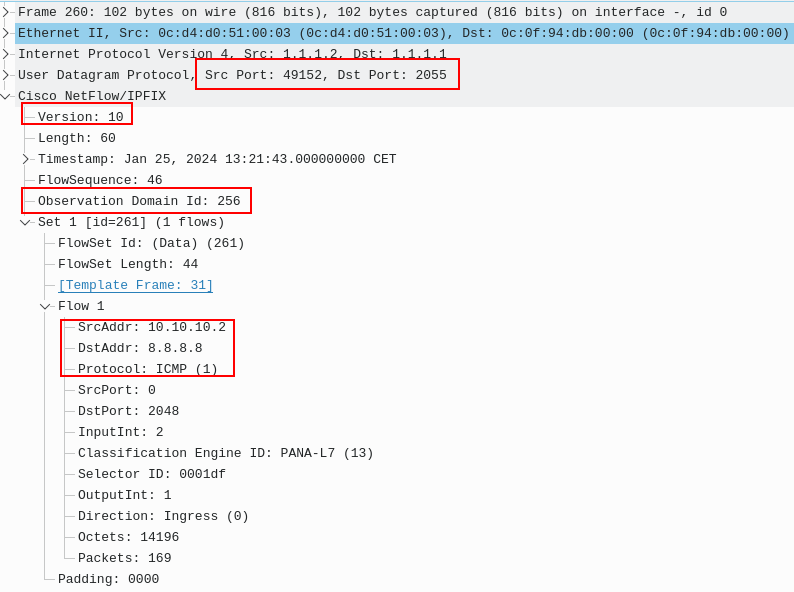
Figure 2 – IPFIX Message with Observation Domain Id: 256
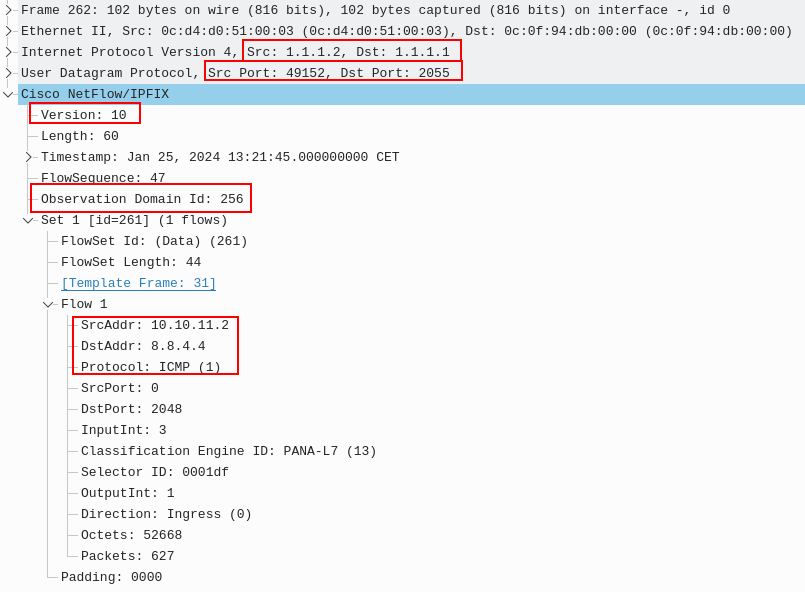
Figure 3 – IPFIX Message with Observation Domain Id: 256
3. Configuration 2: Multiple Exporting Processes
We have made adjustments to the configuration of our router, Exporter, setting up two exporters: EXPORTER-1 with the IP address 1.1.1.1 and EXPORTER-2 with the IP address 1.1.1.10. Consequently, we now have two separate exporting processes running on the Exporter.
These exporting processes generate IPFIX flows, containing data about network traffic monitored by a Metering process. In these flows, we observe two distinct Observation Domain IDs: 256 and 512.
Observation Domain ID 512 is associated with interfaces Gigabit Ethernet 2 and 3, which function as Observation Points within the same Observation Domain. Likewise, interfaces Gigabit Ethernet 2 and 3 serve as Observation Points for the Observation Domain with ID 256 (refer to Figure 4).
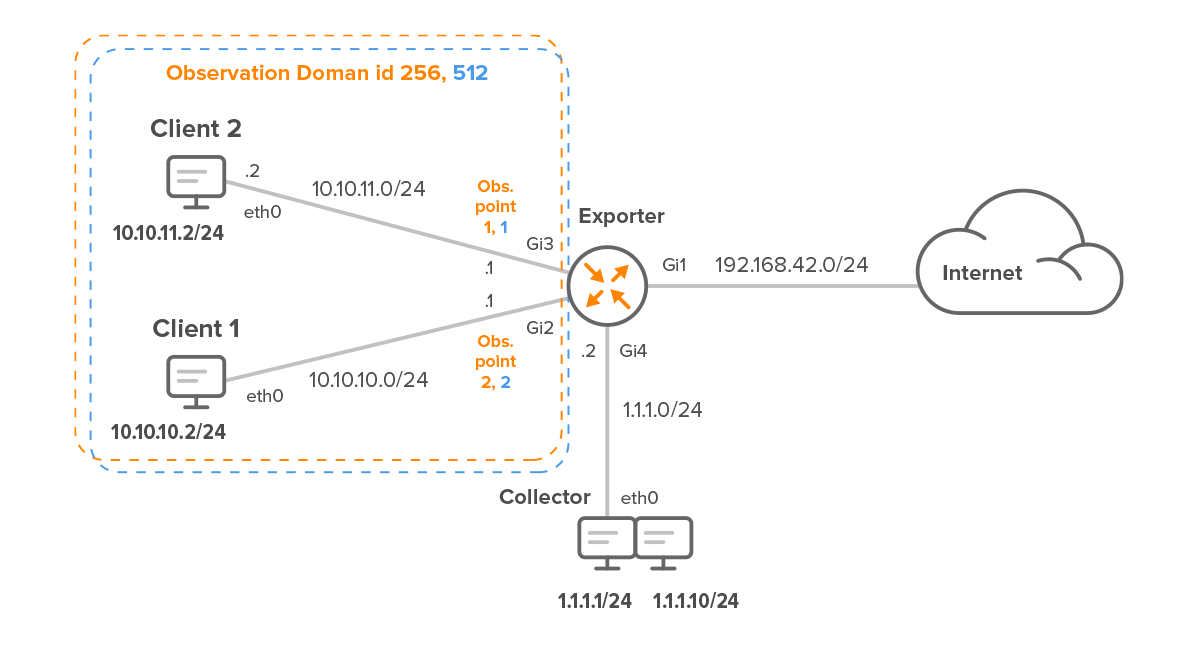
Figure 4 – Network Topology with Multiple Exporting Processes
3.1 Flow Record
The Flow Record RECORD defines the fields to match and collect.
flow record RECORD
  match ipv4 protocol
  match ipv4 source address
  match ipv4 destination address
  match transport source-port
  match transport destination-port
  match application name
  collect interface input
  collect interface output
  collect flow direction
  collect counter bytes
  collect counter packets long
3.2 Flow Exporters
EXPORTER-1 exports flow records to the destination IP 1.1.1.1 using UDP port 2055 and the IPFIX export protocol.
flow exporter EXPORTER-1
  destination 1.1.1.1
  source GigabitEthernet4
  transport udp 2055
  export-protocol ipfix
  option interface-table
  option application-table
Similarly, EXPORTER-2 exports flow records to the destination IP 1.1.1.10 using UDP port 2055 and the IPFIX export protocol.
flow exporter EXPORTER-2
  destination 1.1.1.10
  source GigabitEthernet4
  transport udp 2055
  export-protocol ipfix
  option interface-table
  option application-table
Both exporters are configured to include interface and application tables in their exports.
3.3 Flow Monitor
FLOW-MONITOR-1 configuration binds the flow record RECORD to the flow exporters EXPORTER-1 and EXPORTER-2. This configuration essentially dictates where the flow records defined by RECORD will be exported.
flow monitor FLOW-MONITOR
  exporter EXPORTER-1
  exporter EXPORTER-2
  record RECORD
3.4 Interfaces
Both interfaces have flow monitoring enabled for incoming traffic.
interface GigabitEthernet2
  ip flow monitor FLOW-MONITOR input
  ip address 10.10.10.1 255.255.255.0

interface GigabitEthernet3
  ip flow monitor FLOW-MONITOR input
  ip address 10.10.11.1 255.255.255.0
Figures 5 and 6 illustrate IPFIX messages corresponding to Flow 1. This flow encapsulates information regarding ICMP traffic originating from Client-1 directed towards the Google IP 8.8.8.8.
The attributes recorded in the flow remain consistent across both IPFIX messages, aligning with the specifications defined by the match and collect statements outlined in Part 3.1.
However, distinctions arise in transport session parameters, including the destination IP of the Collector and the Observation Domain ID, due to the configuration of two Exporting Processes on Exporter.
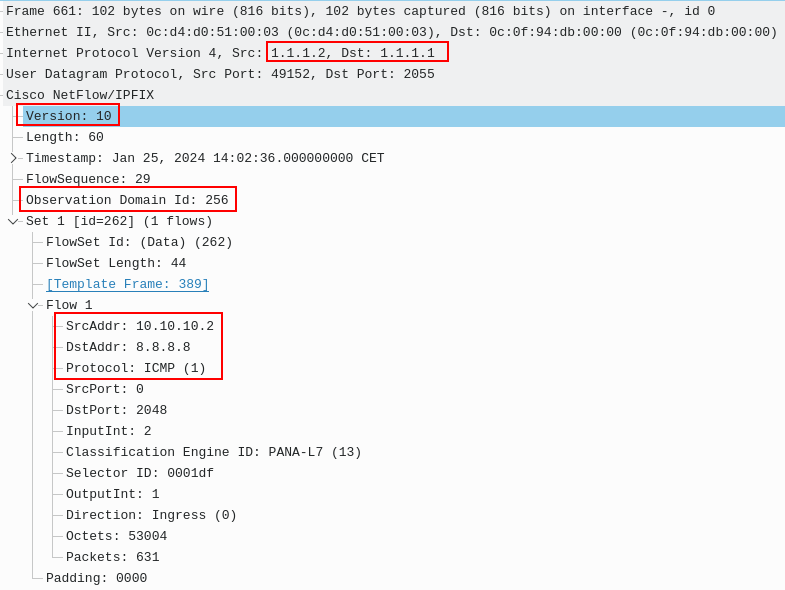
Figure 5 – IPFIX Message with Observation Domain Id: 256
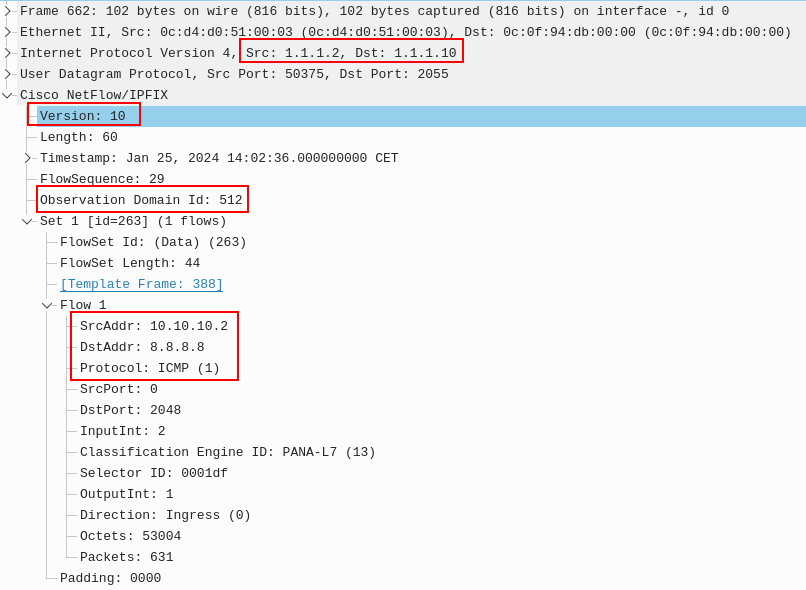
Figure 6 – IPFIX Message with Observation Domain Id: 512
Conclusion
In this article, we explored the concepts of Observation Point, Metering Process, Observation Domain ID, and Source ID in NetFlow v9 and IPFIX protocols. These elements are crucial for effective network flow monitoring and analysis.
The Observation Point refers to a specific location within a network infrastructure where packets are observed, allowing administrators to gain comprehensive visibility into network traffic. The Metering Process is responsible for observing packets, timestamping them, and classifying them into flows based on defined criteria. It also maintains flow records and statistics for monitoring and performance analysis.
The Observation Domain represents a logical block that groups Observation Points within an IPFIX Device, with each Observation Point associated with a unique Observation Domain ID. The Source ID field in NetFlow v9 helps distinguish between different export streams originating from the same exporter and separates flows from different exporters.
The article then presents two different configurations to illustrate these concepts. In the first configuration, a single Observation Domain is set up on the exporter using two Observation Points. The second configuration introduces two Observation Domains on the exporter, with two distinct Observation Domain IDs.
Understanding these concepts is essential for network administrators and analysts to monitor and manage network traffic effectively.